PhD Organization Sensation: "p"LANNING "h"OW-TO "d"O-THINGS

I spend a lot of time getting myself organized. I make lists. I love lists. What I love even more than making lists though, is crossings things off. Sometimes, I’ll accomplish things that I didn’t put on my list and then write them on just so I can cross them out. I still have the same feeling of accomplishment.

Over the past 3.5 years of my PhD work, I tested out different methods of getting organized and planning out what to do, when to do it, how to do it, why I’m doing it, etc. I’ve tried Bullet Journals, building an Everything Notebook, Panda Planners, White Boards, Old-fashioned Print off Calendars, academic planning pipelines, the Google Calendar, WorkFlowy, Google Doc, Paper and pen, “a Quarter by Quarter 30min plan” (my own device), and more. I’ve had varying success with these different techniques and ultimately found a combination that worked really well for me. This leads me to my number one piece of advice for planning and organizing yourself: FIGURE OUT WHAT WORKS FOR YOU. Obviously, this probably isn’t what you want to hear. You want to know what the solution is… that one thing, that if you do it, life will be simpler and streamlined and efficient and you’ll somehow morph into an academic savant. Well, sorry to be the bearer of bad news, but just as there isn’t a magic diet pill or language learning serum or text-to-brain tea, you have to roll up your sleeves, be prepared to fail, and figure out what tool or tools help you, do you, better.

Ultimately, I found a combination of items that works for me- Print off calendars, academic planning pipeline spreadsheet, Google Docs, Google Calendar, WorkFlowy, Paper and Pen, and my “Quarter by Quarter 30min plan”. I like redundancy - I need it. Maybe because it drives it home and I can use what is helpful depending on where my headspace is at any given time? Who knows- again figure out what works for you. I also like that with this combination of items, I am set for tracking items, seeing what state they are in, remembering the details of what I worked on related to each project, keeping track of progress and what’s coming up, and reflecting on what worked/didn’t work and of course, my failures and accomplishments. I’ll explain a bit more. The process I generally use is as follows:

  1. Quarter by Quarter 30min Plan: Using excel (low tech!), I make a weekly calendar by 30min increments for the upcoming quarter. I add everything that I know is set in stone (lab meetings, classes, standing appointments, etc.). I keep it nearby because I’ll be editing/adding/changing based on the rest of my planning. See template here. Again, do what works for you. Maybe you like 1 hour increments better? This plan also allows me to better plan things like office hours and lets me see quickly how much time is being dedicated to each “category of work” (see right-side of template so I can redistribute if need be.

  2. Google Doc: For the academic year, I’ll make a list of everything I want to accomplish that year. Once I’ve completed my list, I reflect on whether the list seems doable during an academic year. If it doesn’t, I see if I can cut anything or I make a note of where I may be able to take a different approach to ease the workload (for example, hiring an intern). I then add bullets under each of the to dos to capture the details of each task including a due date if it’s a non-self imposed deadline (e.g. a grant application deadline). I again reflect on whether it seems doable and adjust as necessary.

  3. Google Doc: Next, I make a table with 4 columns. In the first column, I put all my “to dos” from #2. In the next column, I assign an academic quarter when the work needs to be done (the final stage of each task). In column 3, I put the month that the task needs to be done. Finally, in column 4, I expand the task and hash out what needs to be done each week. For example, for my Qualifying Exam Requirements I may add several pieces to this last column (W4 April - Field Statement due; W1 May - Submit Full Proposal; W2 May - Write Essays; W4 May - Take QE).

  4. Google Doc: I then write out the months and add each piece from column 4 under the appropriate month. For example, Under May, I’ll put “W1: Submit Full Proposal” and “W2 - Write Essays” and “W4 - Take QE”. I once again reflect on whether things seem doable and adjust as necessary. See my template that covers steps 2-4.

  5. Google Calendar/Print Calendar: Once I’m ok with my goals and tasks and timelines, I then add the major tasks (column 1) to the calendar based on their due dates. Again I like doing this on my virtual and my print calendar so I can always access it based on my mindset.

  6. Quarter by Quarter 30min Plan: Based on my list of to dos for a quarter (or semester if you’re on semesters), I look at the time that is not yet assigned on my Quarter by Quarter 30min Plan and add chunks of time to ensure I can get my items done. For example, I may block a 4-hour chunk on Monday and call it “QE Prep”, then block a 2-hour chunk on Tuesday and call it “Grant Applications”. This part obviously isn’t necessary, but again it helps me figure out if I have enough time each week during the quarter to accomplish what I want to…

  7. Academic Pipeline: Any papers/book chapters/grant proposals get added to my academic pipeline spreadsheet. This lets me keep track of where things are (their status), next steps, what’s been accepted, what’s been rejected, etc. This article by Dr. Erin Marie Furtak is really helpful in explaining this portion a bit more. You can customize your academic pipeline to what works for you. I have one pipeline design that I made for funding applications only. I keep track of what’s required for applications, when they’re due, how much they’re for, if I’ve been accepted or rejected, when money needs to be spent by, when notifications come out, etc. The funding version can be really helpful for early grad students seeking funding.

  8. WorkFlowy: This is a “to do list” app. I like it because of its simple formatting. There is a free version and a pay version with a few more bells/whistles. I like it because it’s digital and you can add hashtags for easy filtering. Workflowy consists of bulleted lists. So you can add “QE Planning” and then add a bulleted list under “QE Planing”. Then you continue on with that format. For example:

Screen Shot 2018-12-16 at 3.02.00 PM.png

So, I typically take the steps from “column 4” of the table I produced in steps 2-4 above and add them to my WorkFlowy under the appropriate categories (which should roughly match the items in “column 1” of the table). The weeks that I assigned to each column 4 task become hashtags. For example, if I had a goal of “Taking and Passing My QE” (column 1) and one of my tasks was “Form a QE Committee by W4 December 2018”, I’d have a main bullet “Take/Pass my QE” and under it, a sub-bullet that reads “Form QE Committee Dec. 2018” with the hashtag #W4 December.

Then, before the quarter begins, I select a time that I will do my “daily planning” every single day. Because I’m taking French at 8:00am and it meets 5 days a week, I do my planning directly after at 8:50/9:00am. To do this, I pull up my WorkFlowy and first add any new items that I’ve thought of since yesterday that might not be on there. I decide as I add them if they need to be done today or another time. I add an appropriate hashtag. For example, one day I might have received a meeting invite for later in the week. I’ll add that invite as a bullet to WorkFlowy with the hashtag “#thisweek” because it’s something for this week but NOT TODAY. Once new items are added, I filter the WorkFlowy on the appropriate week’s hashtag to see everything I had planned on accomplishing (for example, “#W4 December”). I look through the items and decide if any of them have to be done today- if so, I add “#Today” otherwise I add a hashtag with a different day of the week (e.g., #Wednesday or #Friday). Once I’ve made it through the full list, I filter my WorkFlowy for the current day. For example, on Monday, I’ll filter for “#Monday”. This lets me see any items that I decided would be done on Monday instead of the previous day. Once again, I decide yes they need to be done today (and then I add #Today) or if they can be done another day (and then I add another day or #thisweek or #next week depending). Once I’ve done that, I filter my WorkFlowy on “#Today”. This gives me a list of everything I’ve decided needs to be done today and filters out everything else that could distract me. I know this seems like a lot but once you do it once or twice you get used to it. I do my daily planning in about 5-10mins a day and it has changed my life. As you accomplish items you can cross them off the list. What’s nice is there is a still a record of everything you’ve crossed off— so you can go back later and see what you accomplished at any time. At the end of the day, if I haven’t accomplished anything, I change the item’s hashtag to the next day so I’ll see it when I’m doing daily planning tomorrow. In this way, things don’t get lost.

8. Paper and Pen: The final item I use for organization and planning is paper and pen. I have a big spiral ring notebook and each day I put the date at the top of a fresh piece of paper. As I work on items and save them places, I write what I’m working on, what I’m doing, and where I’m saving them. For the “what I’m doing” - I’ll make a note of what changes I make to a project (and why, when appropriate). This process is a tip given to me by an old boss that’s really come in handy. it provides an archival record of decisions I’ve made. It really comes in handy!! For example, when I receive an R and R down the line that asks me to make changes to an R-table… I can go back into this notebook and see where the latest version was saved. I can also see a record of how I formed the R-table and why… so I can make sure I don’t mess up my data analysis when I go to make changes. This may seem like a tedious task but it really helps when you get feedback/comments after a couple months of not looking at something and completely forgetting why you did what you did!

So, there it is- my process for planning and organization. I know I put a lot o details in here, but I think they help explain my mental flow. To recap, I use this combination of tools to help me with planning/goal setting, to track work in progress, to keep an active list of accomplishments (and failures), and to remind myself that I really am making progress even if there are days when it seems like I am not!

I’m always interested in how people organize themselves and plan and track their projects, accomplishments, failures, etc. Hopefully, this helps someone out there! Cheers, Meghan

office.gif

Quick and Dirty Reflection on 2 Months Abroad

As of last Friday (August 17th) I have been abroad for 8 weeks. While I do plan on writing a longer post at the end of my trip (which is unfortunately/fortunately approaching quite rapidly - more on that later), I wanted to do a quick reflection on travel and life in Europe. So, here we go, some of my takeaways:

Sweden/Denmark:

  1.  It is quite possible that I did not speak a word of Swedish or Danish while there - now, I was in major cities (Stockholm, Gothenburg, Copenhagen) but still. This is something that many Americans most likely take for granted. Signs and menus are in English. People are readily willing to switch to English. The next time you're in a major city in the U.S. take stock of how much non-English is around you.
  2. Stockholm has quite possibly the greatest public transit system in the world. It's easy to use, it's easy to understand (compared with pretty much everywhere else I've been) and it's on time and clean.
  3. Denmarkians are bike gods. This may seem like a no-brainer, but really, they take biking to a new level. You might think you can bike, but you can't Danish bike. That takes practice.
  4. Christiania is a super cool place that I think gets overlooked because of its sale of marijuana. There is much more to this town than Pusher Street so do yourself a favor and go.
  5. Denmark takes food trucks to the next level (much like biking!) They have a whole area in the city that is just food trucks (and a beer hall)-- there's music and water and happiness AND it's a destination. There's a bus stop right next to it. 

Germany: Full disclosure, I was only in Freiburg

  1. Freiburg is a badass town full of lovely people- but you do need some German (or be really comfortable pointing and miming). You can feel a language barrier here, but again it's nothing compared to what people face when they come to the U.S.
  2. Freiburgians are no joke when it comes to biking- they love biking, they have giant rental bike places by the train station, and they'll bike you until you're good and tired... and it will be worth it.
  3. Freiburg loves music and drinks, but they're into old school beer. Meaning, if you want something besides a simple lager, don't expect it. The main brewery in town brews 1 (maybe 2?) beers. They're refreshing on a hot day but they don't have crazy brews that U.S.-bounders might be craving.
  4. German food is meat and carb heavy and it is delightful. After Sweden/Denmark where I was basically a vegetarian for a month, Germany was the opposite end of the extreme. But it was all amazing. From späetzle to sauerkraut to sausages to potatoes to pretzels. Yum.
  5. German train systems are not as well-oiled as Sweden/Denmark. While the rail system is still great, it did not have the punctuality of Sweden/Denmark nor the clarity that its northern neighbors possessed...Note, still WAY BETTER than in the U.S.

Switzerland: Since I spent almost a month here I won't go into the gory details in this post, but just a few highlights:

  1. Train travel may be the way of Sweden and Denmark, but I'm telling you, Switzerland has perfected it. Signage everywhere... that syncs with their app that syncs with the track notifications that syncs with the announcements (given in German, French, and English). And everything's on time and if a train is late there are, wait for it, apologies. It's crazy!
  2. Wait are they speaking German or French? Or Italian? Depending on where you are there is a language barrier... and it can get confusing if you think you need German but you are actually in the French portion of Switzerland... let alone the Italian portion. Learn some key phrases.
  3. There is a very big cultural divide between German Switzerland and French Switzerland. It would probably take a book to adequately describe and discuss the differences. Come visit and see for yourself.
  4. As a guest you can get a month-long Swiss half pass which gives you half fare on 2nd or 1st class train tickets. It's almost always a better deal than the Swiss unlimited travel pass so check it out. You do need to print it if you order online but all their other tickets are digital which is nice.
  5. Depending on where you are there are free public transit passes! Geneva and Lausanne hotels give you free transit passes which is rock and roll (especially in Lausanne where its hilly).
  6. Sundays are days of rest... aka a lot of stuff is shutdown or closed. Rather than getting angry or annoyed about it, plan your time better and enjoy the fact that you get a whole day a week when you don't have to run errands because you have a valid excuse.
  7. Grocery stores- bring your own bag or pay for one. Plain. Simple. Everyone brings their own. Amazing.

Ok, I will stop there for now- especially because this got a bit longer than planned. The only other thing I'll mention is the "unfortunately/fortunately my trip is ending soon" comment I mentioned above. 8 weeks (well 9+ by the time I leave) is a long time to leave family and friends (and beloved 4-legged children) so I am really excited to be home for those reasons. However, I absolutely love it here and am already planning my next trip. Europe is doing really well on many many things and the U.S. could adopt a few lessons...  but more on that later!


Sustainable Cities of Northern Europe: Royal Seaport Development in Stockholm, Sweden

On July 2nd, 26 undergraduate students from the United States, myself, and one UC Davis Instructor met at the Rygerfjord Hostel and Hotel in Stockholm, Sweden. Our group is exploring four countries (Sweden, Denmark, Germany, and Switzerland) over the month of July. Our cause? The Sustainable Cities of Northern Europe program -- more affectionately known as (and from now on referred to as), SCONE.

SCONE is a UC Davis Summer Abroad program aimed at studying cities, systems, and plans in Northern Europe that are 'sustainable'. It involves walking, biking, bus-ing, ferrying, and train-ing across several cities and countries. We meet with local planners and experts and tour new transit systems, pocket parks, sustainable housing projects, new community eco-designs, and much more. We, of course, have a lot of fun along the way meeting new people, exploring new cultures, and comparing what we learn to how things are set-up in the United States. Our first stop on the tour was Stockholm, Sweden. We spent a week living aboard the boats of the Rygerfjord Hostel and Hotel. The hostel is quite literally three boats that are anchored in Stockholm. The location of the hostel is just south of Gamla Stan (Old Town).

Photo Credit: Baltic Sea Cruises

Photo Credit: Baltic Sea Cruises

As part of the course students are required to develop Story Maps with a theme of sustainability across the cities we visit. The hope is to compare what we learn abroad with existing structures at home to inform future planning/development ideas on sustainability. Once the students develop the Story Maps I’ll be sure to link to them here! So, what is my role? I am very fortunate to have been invited along as an onsite coordinator. Think mother hen-role :). I stay with the students, make sure they get where they need to be, help with anything that comes up (doctors, traveling, homework, etc.). It’s a great role and something that I love doing - I remember my own study abroad programs from undergrad and how much fun I thought it would be to help plan and coordinate them in the future! Anyway, back to sustainability.

Day 1 in Stockholm, Sweden: Royal Seaport: a 236 Hectare area (~583 acres) that the Stockholm City Council decided to develop in an environmentally-friendly and sustainable manner. The area (seen in the map below) is scheduled to be completed in 2030 and will contain 12,000 new homes and 35,000 new workplaces. The project is projected to cost € 2.2 billion (~$2.6B) and has a goal of 55 kWh of energy per square meter per year (~55 kWh per 10.8 square feet). The planned community includes a mix of green space, commercial/retail areas, living options, and eco-transportation options. The Royal Seaport project is committed to reducing GHGs and moving towards fossil-free fuel. As such it promotes electric hybrid and biogas fueled buses along with ensuring strong connectivity between pedestrian, cycle, and metro options. The Royal Support proposes to meet future Stockholm growth in a climate-friendly way.


**The area highlighted in orange represents the area of development, a 10-minute bike ride from center city Stockholm.

Photo Credit: Stockholm Royal Seaport

After spending some time with Anna Hughes Cambry, Information Officer with the City of Stockholm, in the Royal Seaport Visitor Center, we headed out for a walking tour of the community. The area boasts a great deal of green space, some of which was designed with the help of children (notice the students crawling through a tunnel formed by growing plants in the image below). Stormwater management was also carefully considered in the community - they incorporated sunken gardens to allow for potential flooding. Walkways and downspouts are angled for stormwater to flow into the sunken gardens as well. Trash and recyclables are dealt with in a much different manner than seen in most of the U.S. - community members separate their waste into several different categories including glass, metal, papers, and ‘incinerator trash’ (trash that will be burned and used to heat water that will be pumped through houses for warmth). Each category has a colored ‘collection bin/pipe’. Once it becomes full, a giant “vacuum” is activated which sucks the trash away (see picture in the top center position below). The Royal Seaport is a truly dynamic, well-thought out, and sustainable community.

Photos taken at the Royal Seaport Project, Stockholm, Sweden

Photos taken at the Royal Seaport Project, Stockholm, Sweden

To provide somewhat of a comparison (summarized in Table 1 below), West Village, a planned 222-acre development in Davis, CA being touted as “the largest planned ‘zero net energy’ development in the nation” (Chang 2013), cost about $200M to develop, including about $20M secured through state and federal funding. Sources describe the community as providing housing for between 2,000 (Davis 2018) and 3,500 people (Chang 2013) in apartments. Ultimately, the goal is to also build between 350 and 430 single family homes. In addition to housing, West Village contains between 35,000 and 42,000 square feet of commercial space as well as ample green space, a strong transportation network, and some restaurants and cafes. While the goal of West Village is ‘zero net energy’, a report from the 2013-2014 year shows that the community only met 87% of its demand (West Village Annual Report 2014). West Village does not have a fancy waste collection protocol like the Royal Seaport and stormwater management appears somewhat non-existent (although they do have some bioswales and GreenWorks claims there is stormwater treatment). Interestingly enough, Davis, CA receives on average 19.66 inches of rain a year compared to Stockholm, Sweden's 20.75 inches a year (!). I really thought Davis received way less precipitation...but maybe I'm still suffering from Drought whiplash. 

While West Village does have green space, it lacks little touches like tunnels made out of plants (!) and really any ‘child-specific’ play areas. Part of this is likely because the housing is catered to undergraduate students at UC Davis. However, with plans to construct between 350-430 single family homes it make one wonder if there are any plans to make the area more ‘kid friendly’.


Table 1. Summary of Royal Seaport and West Village

                                   Royal Seaport (Stockholm, Sweden)               West Village (Davis, CA, USA)

Cost                                                            $2.6B                                                              $200M

Size                                                      ~ 583 acres                                                        ~222 acres

Housing                                             ~ housing for 12,000                               ~housing for 2K - 3.5K 

                                                     (no single family homes)                       ~350-430 single family homes

Energy                                         goal: 55kWh/10.8 sq ft.                                    goal: zero net energy*

                                                                                                              partial development: 87% of demand

Child-Friendly                       children included in design                          nothing geared to kids

Transportation                buses, bikes, walking, min. cars             buses, bikes, walking, cars, min. cars

Stormwater Mgmt.     sunken gardens, directed downspouts,        proposed stormwater treatment,

                                                   bioswales, green pockets                    bioswales, groundwater recharge


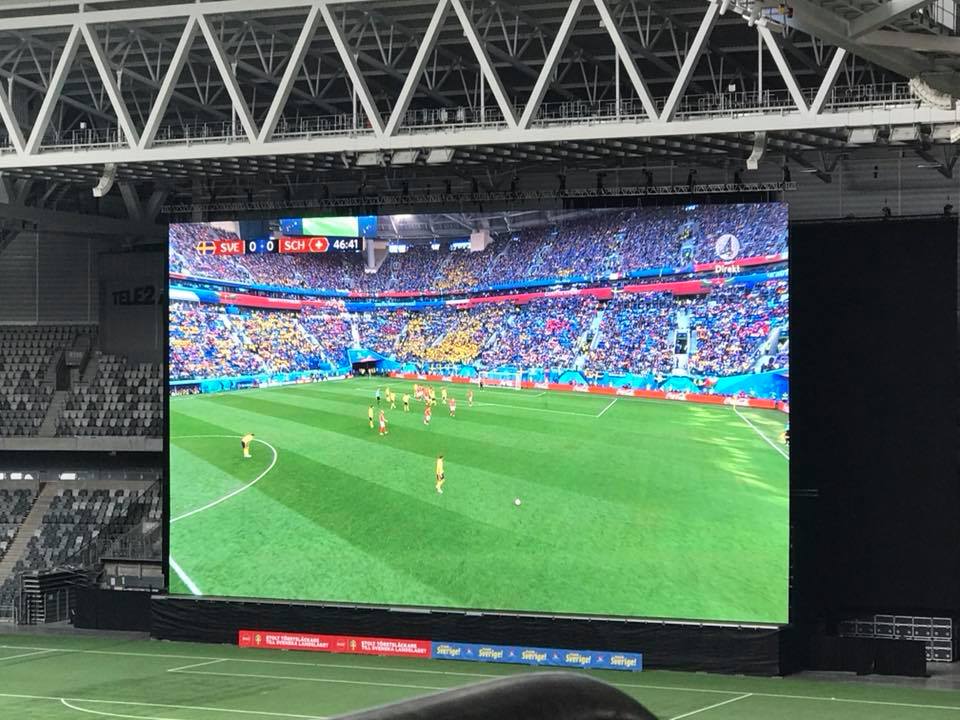
In the afternoon, we naturally had to watch the Sweden World Cup game. We dispersed to various venues to watch the game -- some of us were lucky enough to get into the Tele2 Arena which boasts Europe’s largest screen for watching the game… what’s even more awesome is that Sweden won! Woohoo! It was a great first day!

sweden1.jpg
Sweden2.jpg

References

Chang, R. 2013. UC Davis West Village falls short of zero net energy goal. The Sacramento Bee. Last accessed: 09 July 2018. <https://www.sacbee.com/news/local/education/article2584057.html>.

UC Davis West Village Energy Initiative Annual Report 2013-2014. 2014. Last accessed: 09 July 2018. <https://energy.ucdavis.edu/wp-content/uploads/2017/06/UC-Davis-West-Village-Energy-Initiative-Annual-Report-2013-2014.pdf>.

UC Davis West Village. 2018. Last accessed: 09 July 2018. <https://westvillage.ucdavis.edu/>.

Stockholm City. 2018. Royal Seaport. Last accessed: 09 July 2018. <http://www.stockholmroyalseaport.com/>.


Small, self-sufficient water systems continue to battle a hidden drought

[Cross-posted from California WaterBlog]

My colleague, Amanda Fencl, and I wrote a blog post for the California WaterBlog on small water utilities and the 'hidden drought'. See a copy of the text below. In addition, you can find us on Twitter: Amanda Fencl (@alfencl) and Meghan Klasic (@rogue_PhD).

by Amanda Fencl and Meghan Klasic

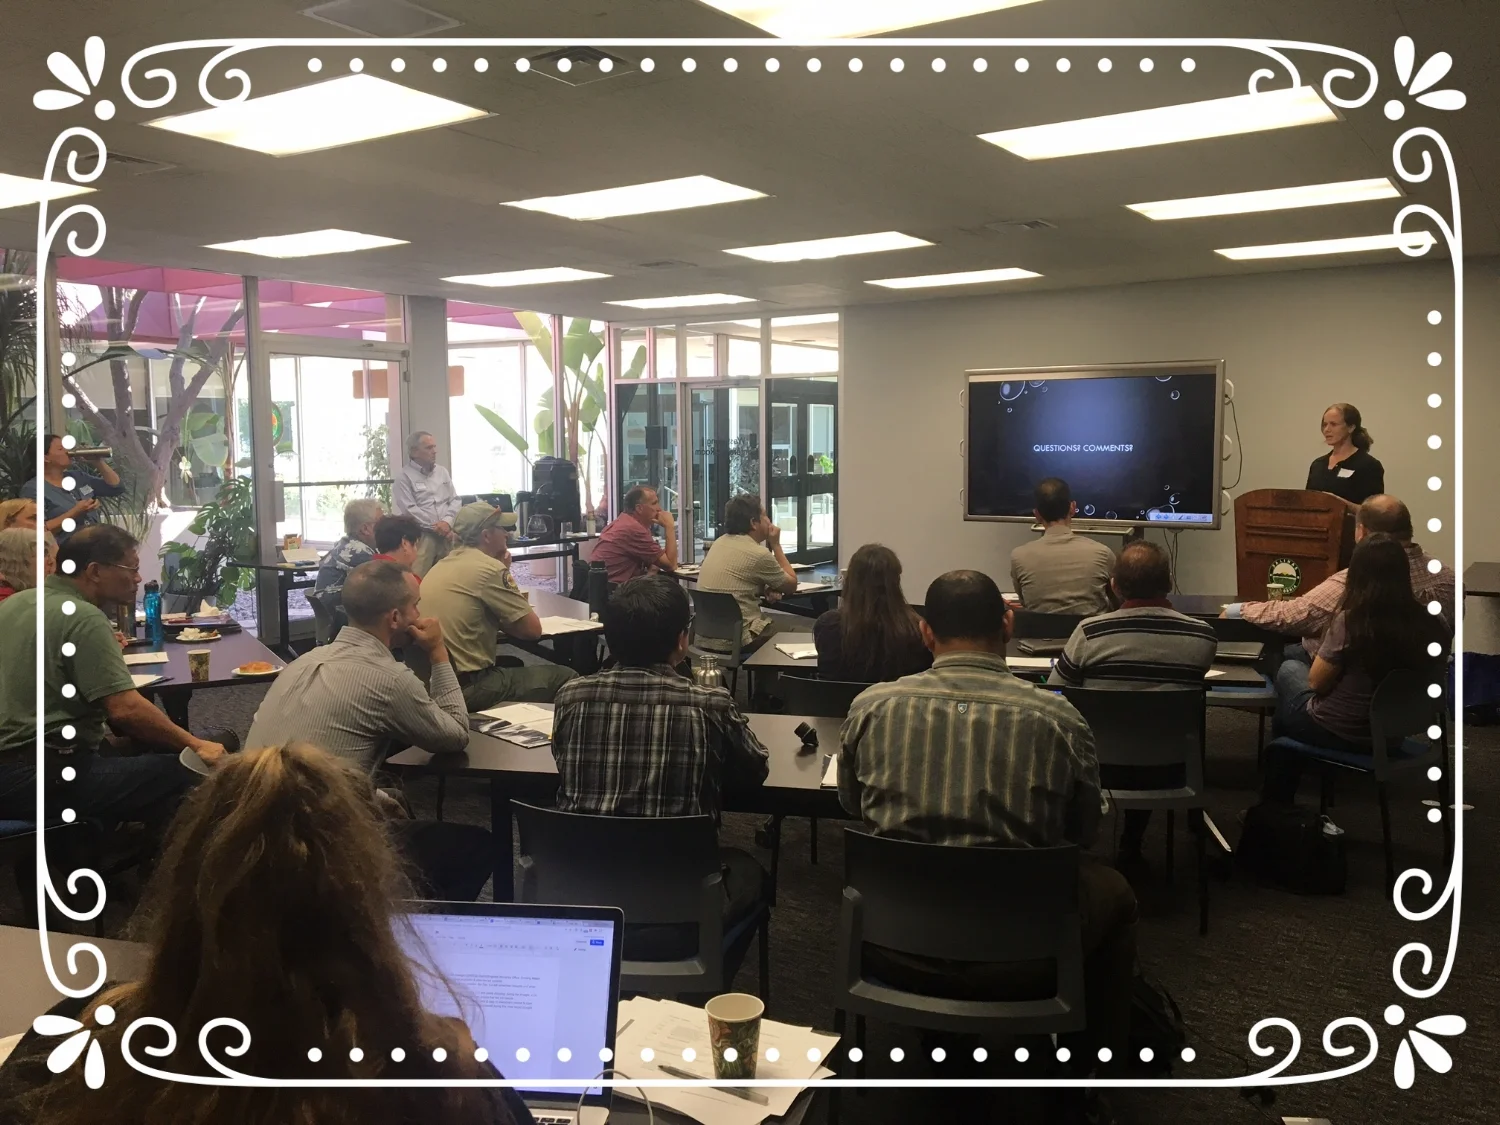
Workshop participants in Salinas in July 2017 discuss ways to build local and regional drought resilience. Photo by A. Fencl

Workshop participants in Salinas in July 2017 discuss ways to build local and regional drought resilience. Photo by A. Fencl

California’s drought appears over, at least above ground. As of April 2017, reservoirs were around 2 million acre feet above normal with record breaking snowpack . This is great news for the 75% of Californians that get their drinking water from large, urban surface water suppliers. Groundwater, however, takes longer to recharge and replenish. What does this mean for the more than 2,000 small community water systems and hundreds of thousands of private well-reliant households that rely on groundwater?


Of the ~25% of Californians not served by large, surface water suppliers, this pie chart shows the breakdown of populations served by system size and water source.

Small water systems are defined in our study as those have fewer than 3,000 connections, i.e. those that are not required to file an Urban Water Management Plan (UWMP). A large proportion of small systems serve low-income communities in rural areas. These communities are burdened with high unemployment, crime, and pollution, and their water systems typically have lower technical, managerial, and financial capacity for operations. Of the approximately 13 million people living within disadvantaged communities (DAC), nearly 2 million get their drinking water from a small system. These low income communities are disproportionately exposed to contaminated drinking water, usually from small systems that struggle to comply with regulations.

These same small systems were hit hard by the drought, and in many cases are the least prepared. The state knew this headed into the drought: “California also has small, rural water companies or districts with virtually no capacity to respond to drought or other emergency [… a portion of the small systems]  in the state face running dry in the second or third year of a drought (p.56, emphasis added). In contrast, urban drinking water suppliers (larger systems) are required to have a water shortage contingency plans (Shortage Plan) since the passage of the Urban Water Management Act in 1983. Aside from lower reservoir levels and toxic algal blooms, the majority of large surface water suppliers weathered the recent drought (2012-2016) without supply disruptions or other negative impacts to their customers. A 2015 survey distributed by the UC Davis Policy Institute shows that more large systems (89%) have written drought contingency plans (Plan) than small systems (63%) (manuscript in prep). When asked whether their Plan was sufficient to mitigate the drought’s impacts on water supply, 22% of large and 28% of small system respondents said it was not sufficient or only somewhat sufficient, which begs the question of how can these be improved before the next drought?

A private, domestic well on rural property outside of Visalia in Tulare County where one of the authors lived during fieldwork. Photo by A. Fencl

A private, domestic well on rural property outside of Visalia in Tulare County where one of the authors lived during fieldwork. Photo by A. Fencl

Small, rural water systems and their frequently disadvantaged residents remain vulnerable to quality and supply concerns (see Water Deeply’s Toxic Taps series for a look at these concerns in the Central Valley). They usually only have one or two different water sources and have few permanent or emergency interties with neighboring systems; this limits their supply flexibility, which is critical during multiple dry years. Small systems account for 71% of systems that faced drought-related supply or quality emergencies and sought financial assistance from the State Water Resources Control Board (Water Board).

Furthermore, 2800+ households on private, domestic wells reported problems due to the drought. The severity of private well failures prompted the Water Board to create a one-time funding program to assist households and local/state small systems (those under 15 service connections): $5 million was available as low-interest loans or grants.

Recognizing the extra burden of small systems, the 2016 Executive Order Making Conservation a Way of Life directed DWR to “work with counties to facilitate improved drought planning for small suppliers and rural communities”. The explicit focus on these systems and communities highlights the state’s acknowledgment that, “The ongoing drought has brought attention to the reality that many small water suppliers and rural communities are struggling to meet demands with significantly reduced water supplies – or even running out of water altogether” (p.3-17, emphasis added).

DWR’s Draft Executive Order Framework gives counties two years to figure out how to ensure drought resilience for households and areas under their jurisdiction that are otherwise not covered by an existing drought contingency plan. Hopefully, this will ensure that during the next severe drought, we won’t see 2800+ households running out of water; they will have long-term solutions in place. The East Porterville project underway in Tulare County shows what’s possible when state financing and local political will align.


A meeting of community members in East Porterville. DWR explains its plan for connecting ~1000 households on private wells, without running water, to the nearby City of Porterville. June 2016. Photo by A. Fencl

A meeting of community members in East Porterville. DWR explains its plan for connecting ~1000 households on private wells, without running water, to the nearby City of Porterville. June 2016. Photo by A. Fencl

A team of UC Davis researchers interviewed a subset of California’s small “self sufficient” water system operators, managers, and board members during Summer 2016 about drought impacts, responses, and barriers to and options for adaptation. Self-sufficient systems do not purchase or import water from the Central Valley Project nor the State Water Project. In Summer 2017, the team organized three regional drought resilience workshops to complement the interview-based findings: Clear Lake, Modesto and Salinas. These workshops served to underscore the ongoing challenges facing smaller systems, the added water supply and quality pressures during extreme dry years and multi-year droughts, and the important role of the state in supporting local drought resilience.

The final phase of the research project will be day-long Forum on Drought Resilience for Small Systems in Sacramento next month. The forum is jointly hosted by the UC Davis Policy Institute and the Environmental Justice Coalition for Water. It will provide a venue for small system managers, state agency staff, technical assistance providers, and other interested stakeholders to discuss how best to overcome barriers to drought resilience for small systems. For more information on the Drought Forum, contact Meghan Klasic (mrklasic@ucdavis.edu).

Amanda Fencl is a PhD Candidate in Geography at UC Davis.  Her dissertation is on California’s complex drinking water system and its adaptation to drought and climate change.  Meghan Klasic is a 3rd year PhD student in the UC Davis Geography Graduate Group studying transboundary water quality management and climate change adaptation. Many thanks to Dr. Julia Ekstrom and Dr. Mark Lubell for their review and edits. This research was made possible by funding from an NSF Graduate Research Fellowship, California’s 4th Climate Impact Assessment, and EPA STAR.

Further reading

Arnold, Brad, Alvar Escriva-Bou, Jay Lund (2017) San Joaquin Valley Water Supplies – Unavoidable Variability and Uncertainty. California WaterBlog.

Balazs, Carolina and Isha Ray (2014) The Drinking Water Disparities Framework: On the Origins and Persistence of Inequities in Exposure. Am J Public Health. 104(4): 603–611.

DWR (2017) Making Water Conservation a California Way of Life: Implementing Executive Order B-37-16.

Ekstrom, Julia, Louise Bedsworth, Amanda Fencl (2017). Gauging climate preparedness to inform adaptation needs: local level adaptation in drinking water quality in CA, USAClimatic Change.  February, Vol. 140, Issue 3–4, pp 467–481.

Feinstein, Laura et al. (2017). Drought and Equity in California. Pacific Institute.

Harter, Thomas (2017). Post-drought groundwater in California: Like the economy after a deep “recession,” recovery will be slow. California WaterBlog.

Lohan, Tara (2017). Toxic Taps. Water Deeply.

Regional Drought Resilience Workshops

I work as a Graduate Student Researcher under Dr. Julia A. Ekstrom in the UC Davis Policy Institute for Energy, Environment, an the Economy. The work I do concerns drinking water utility management and climate change adaptation. Our research team is working on a multi-year project to understand how small drinking water utilities fared during the most recent drought (2012-2016?). I put the "?" in there because some of these utilities are in fact still dealing with the impacts of the drought. During the summer of 2016, our research team conducted interviews with drinking water utility managers, board members, and operators to better understand management impacts and challenges faced as a result of the drought. As a second phase to this project, we conducted workshops throughout California to hone in on how different socio-ecological regions were impacted differently by the drought. We held three Regional Drought Resilience Workshops: Clear Lake; Modesto; and Salinas. You can read our overviews of these workshops on our Climate Adaptation Program website. We are currently analyzing and writing up our findings, which will be included in a day-long Forum on Drought Resilience for Small Systems to be held on September 20, 2017 in Sacramento, CA. If you would you like more information on this forum, please don't hesitate to reach out to me at mrklasic@ucdavis.edu

Salinas.JPG